
What Are Key Performance Indicators (KPIs)?
KPI stands for Key Performance Indicators. When collecting a lot of data over a period of time, it may be difficult to get a clear picture of what’s going on. It becomes a challenge to tell whether things are really improving or getting worse, and making all that data meaningful becomes hard work.
How KPI Pages Help Visualize Performance Data
In order to better help our Clients see the overarching trends in their processes, KPI pages have been created which allow users to view all that data as a series of live charts that give more specific information on activity for certain departments, processes, or areas of the business.
Where KPIs Are Found in Web QMS Applications
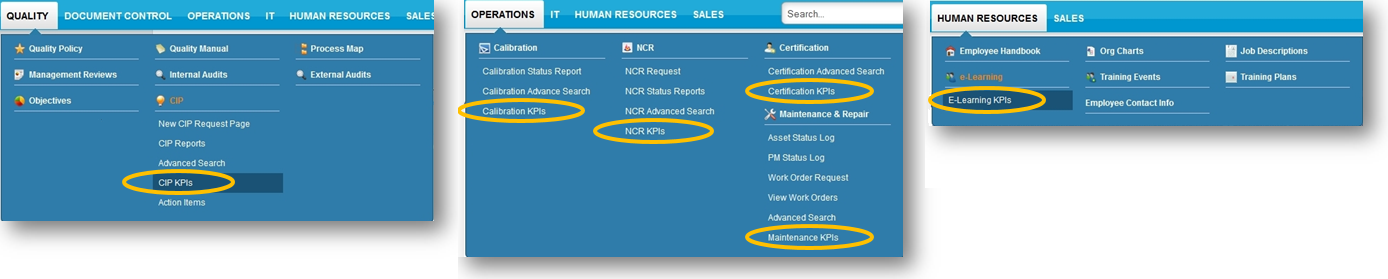
Our Web QMS quality management system software currently has KPIs built in the CIP Application, the Calibration Application, the NCR Application, the Employee Certification Application, the Maintenance Application, and the E-Learning Application, each of which can be found on their own page under their respective department tab.
How to Generate Reports and Charts
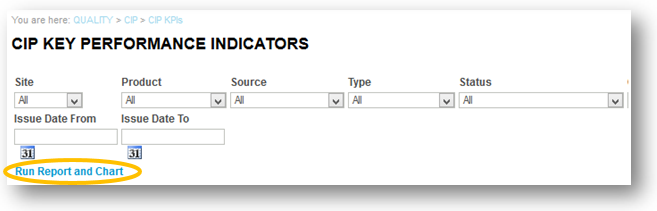
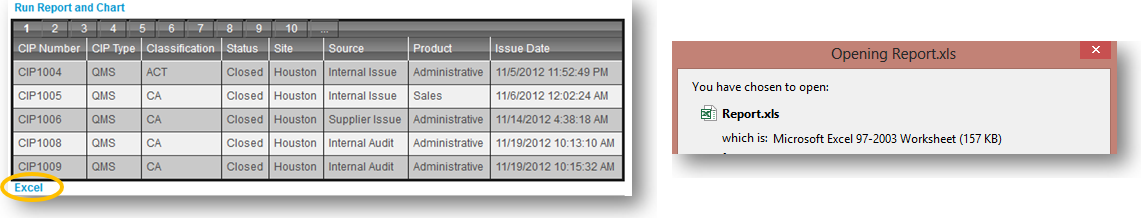
After going to a KPI page, users can filter the data they would like put into graph form, then select “Run Report and Chart.”
Viewing KPI Graphs and Data Tables
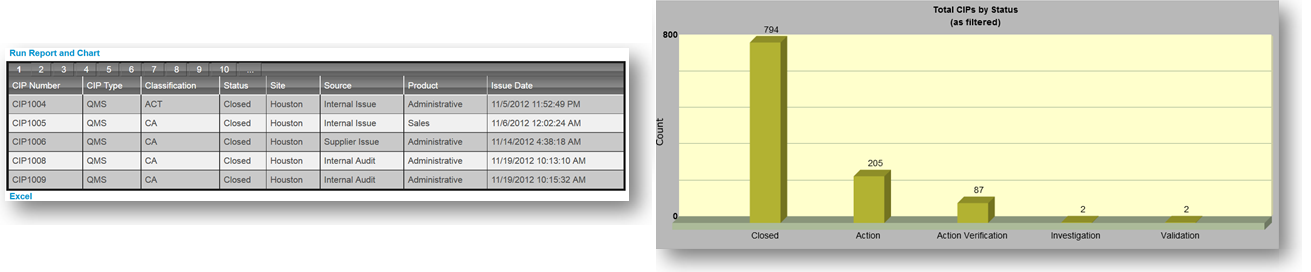
Once “Run Report and Chart” has been selected, the graphs will then generate, along with a table showing all the data the charts are utilizing.
Download KPI Data for Further Analysis
The table data can also be downloaded as an Excel spreadsheet by selecting the “Excel” link below it.
Why KPIs Are Essential for Continuous Improvement
By using these charts and downloadable Excel spreadsheets, companies have a much easier time knowing which of their Objectives are being met and what areas may still need improvement. Instead of having to build and update these charts on their own, they can view the data using multiple parameters and know that the information being used is always up-to-date.
Advance Your Knowledge with API and ISO Training from Mireaux
Whether you’re preparing for certification or want to enhance your team’s expertise, our training programs cover everything from foundational knowledge to advanced best practices. With expert-led courses and real-world insights, Mireaux helps you build the skills needed for success.
ISO Training API Training